1
2
3
4
5
6
7
8
9
10
11
12
13
14
15
16
17
18
19
20
21
22
23
24
25
26
27
28
29
30
31
32
33
34
35
36
37
38
39
40
41
42
43
44
45
46
47
48
49
|
import numpy as np
import matplotlib.pyplot as plt
class GPR:
def __init__(self, h):
self.is_fit = False
self.train_x, self.train_y = None, None
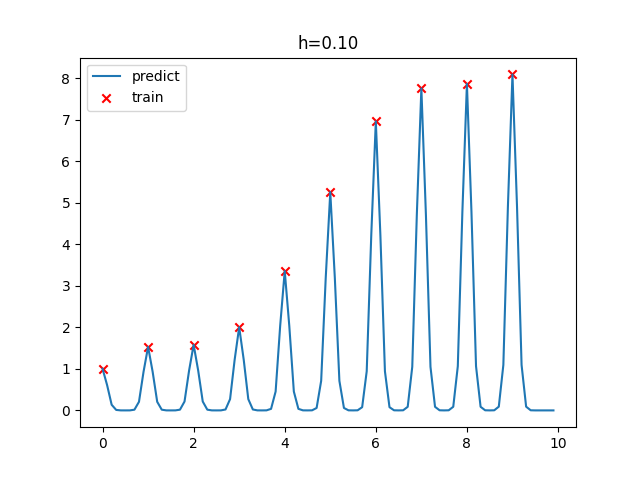
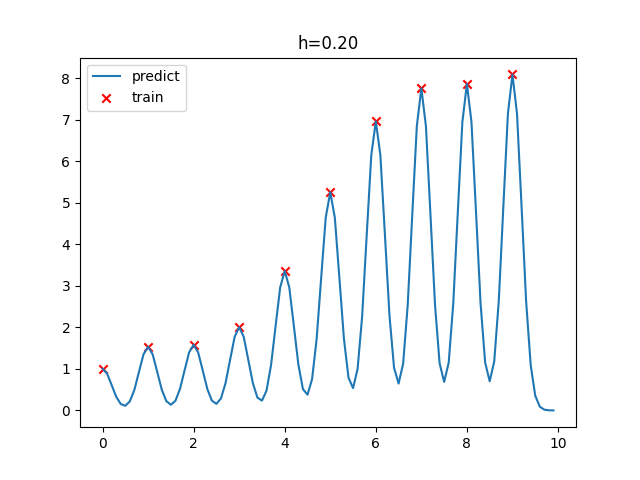
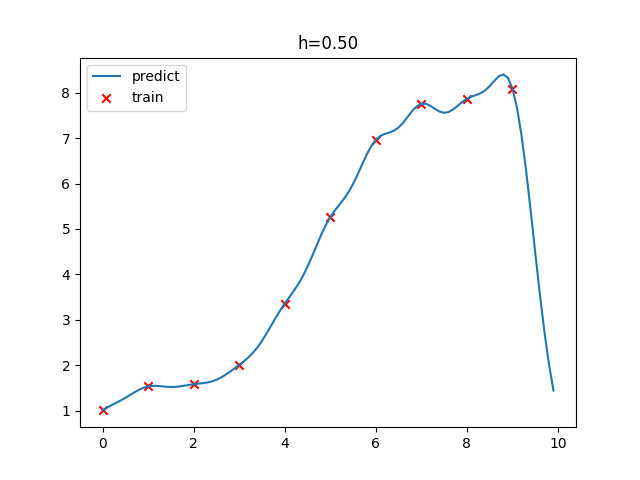
self.h = h
def fit(self, x, y):
self.train_x = np.asarray(x)
self.train_y = np.asarray(y)
self.is_fit = True
def predict(self, x):
if not self.is_fit:
print("Sorry! GPR Model can't fit!")
return
x = np.asarray(x)
kff = self.kernel(x,x)
kyy = self.kernel(self.train_x, self.train_x)
kfy = self.kernel(x, self.train_x)
kyy_inv = np.linalg.inv(kyy + 1e-8*np.eye(len(self.train_x)))
mu = kfy.dot(kyy_inv).dot(self.train_y)
return mu
def kernel(self, x1, x2):
m,n = x1.shape[0], x2.shape[0]
dist_matrix = np.zeros((m,n), dtype=float)
for i in range(m):
for j in range(n):
dist_matrix[i][j] = np.sum((x1[i]-x2[j])**2)
return np.exp(-0.5/self.h**2*dist_matrix)
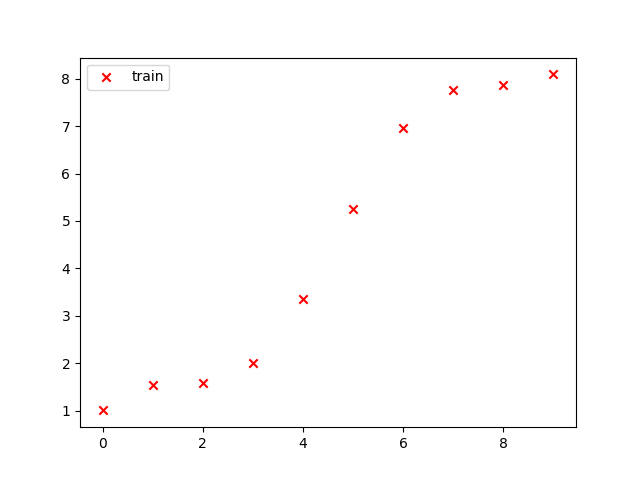
train_x = np.arange(0,10).reshape(-1,1)
train_y = np.cos(train_x) + train_x
train_y = train_y + np.random.normal(0, 0.01, size=train_x.shape)
plt.figure()
plt.scatter(train_x, train_y, label="train", c="red", marker="x")
plt.legend()
plt.show()
|